Data Graph: Visualize Numerical Data on Web Pages
Data Graph is a free Chrome add-on developed by b romney that allows users to create visual plots or graphs from numerical data on web pages. With this tool, users can easily visualize and analyze data without the need for complex software or coding.
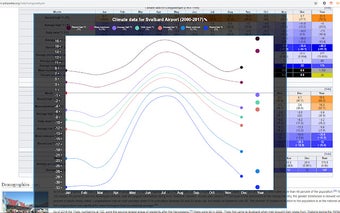
The add-on supports the visualization of numerical data from highlighted or selected text and HTML table elements. By simply highlighting the desired data or selecting specific table elements, users can generate interactive plots or graphs instantly. This makes it convenient for users who want to quickly analyze and visualize data without the need to manually input it into a separate software or tool.
Overall, Data Graph is a handy add-on for Chrome users who need to visualize numerical data on web pages quickly and easily.